Let’s learn how to configure Xdebug on Docker and use this extension to listen for debug connections in PhpStorm or Visual Studio Code.
What is Xdebug?
Xdebug is a PHP extension that provides a range of features such as:
- step debugging
- breakpoints
- profiling
- code coverage
and it is an amazing tool for us PHP Developers. We should all use it but sometimes the setup of the environment could appear too overwhelming and instead we prefer using other tricks like dd(),var_dump(),and so on…
We are going to setup Xdebug in a docker environment which nowadays is probably the most common situation but if you are using Xdebug in a native PHP installation, the same options apply so you could always use this guide.
Dockerfile
First we need to install Xdebug extension in our PHP container. Let’s assume that we have a PHP 8.4 container defined by this Dockerfile:
FROM php:8.4-fpm

# Install system dependencies
RUN apt-get update && apt-get install -y \
    git \
    curl \
    libpng-dev \
    libonig-dev \
    libxml2-dev \
    zip \
    unzip

# Clear cache
RUN apt-get clean && rm -rf /var/lib/apt/lists/*

# Install PHP extensions
RUN docker-php-ext-install pdo_mysql mbstring exif pcntl bcmath gd

# Install Xdebug
RUN pecl install xdebug && docker-php-ext-enable xdebug

# Configure Xdebug
RUN echo "xdebug.mode=debug" >> /usr/local/etc/php/conf.d/docker-php-ext-xdebug.ini \
    && echo "xdebug.client_host=host.docker.internal" >> /usr/local/etc/php/conf.d/docker-php-ext-xdebug.ini \
    && echo "xdebug.client_port=9007" >> /usr/local/etc/php/conf.d/docker-php-ext-xdebug.ini \
    && echo "xdebug.idekey=PHPSTORM" >> /usr/local/etc/php/conf.d/docker-php-ext-xdebug.ini \
    && echo "xdebug.start_with_request=yes" >> /usr/local/etc/php/conf.d/docker-php-ext-xdebug.ini

# Get latest Composer
COPY --from=composer:latest /usr/bin/composer /usr/bin/composer

# Set working directory
WORKDIR /var/www

# Copy existing application directory contents
COPY . /var/www

# Copy existing application directory permissions
COPY --chown=www-data:www-data . /var/www

# Change current user to www-data
USER www-data
Xdebug configuration
What happened here?
We told docker to install the Xdebug extension and to enable it but most importantly, we passed the configuration to be used in Xdebug:
# Configure Xdebug
RUN echo "xdebug.mode=debug" >> /usr/local/etc/php/conf.d/docker-php-ext-xdebug.ini \
    && echo "xdebug.client_host=host.docker.internal" >> /usr/local/etc/php/conf.d/docker-php-ext-xdebug.ini \
    && echo "xdebug.client_port=9007" >> /usr/local/etc/php/conf.d/docker-php-ext-xdebug.ini \
    && echo "xdebug.idekey=PHPSTORM" >> /usr/local/etc/php/conf.d/docker-php-ext-xdebug.ini \
    && echo "xdebug.start_with_request=yes" >> /usr/local/etc/php/conf.d/docker-php-ext-xdebug.ini
In this configuration we’ve set some important options for Xdebug:
- the host: since Xdebug will run in the container we must tell it how it should contact our machine so we provide a hostname host.docker.internal.
- the port: we need to tell Xdebug to communicate with the specified port. This will be the port that we will later choose in our IDE.
- the idekey: we can choose a specific key that will be sent from Xdebug to our machine (IDE)
- start_with_request: if this option is set to yes, it indicates that everytime a PHP script is executed Xdebug is executed too. If we don’t like this we can set it to trigger so that Xdebug will be triggered only if the XDEBUG_TRIGGER or XDEBUG_SESSION (which is now legacy) variable is set in the environment, or sent as a GET / POST param or in a COOKIE.
Docker compose
The container is probably a part of a Docker compose infrastructure:
version: '3.8'

services:
  # PHP-FPM Service
  app:
    build:
      context: .
      dockerfile: Dockerfile
    container_name: laravel-app
    restart: unless-stopped
    working_dir: /var/www/
    volumes:
      - ./:/var/www
    environment:
      PHP_IDE_CONFIG: "serverName=Docker"
    extra_hosts:
      - "host.docker.internal:host-gateway"  # Required for Xdebug to connect back to host
    networks:
      - laravel-network

  # Nginx Service
  nginx:
    image: nginx:alpine
    container_name: laravel-nginx
    restart: unless-stopped
    ports:
      - "8099:80"
    volumes:
      - ./:/var/www
      - ./docker/nginx/conf.d/:/etc/nginx/conf.d/
    networks:
      - laravel-network
    depends_on:
      - app

  # MySQL Service
  db:
    image: mysql:8
    container_name: laravel-db
    restart: unless-stopped
    environment:
      MYSQL_DATABASE: laravel
      MYSQL_ROOT_PASSWORD: root_password
      MYSQL_PASSWORD: db_password
      MYSQL_USER: db_user
    volumes:
      - dbdata:/var/lib/mysql
    ports:
      - "3333:3306"
    networks:
      - laravel-network

# Networks
networks:
  laravel-network:
    driver: bridge

# Volumes
volumes:
  dbdata:
    driver: local
here the only configuration that we need is:
 environment:
      PHP_IDE_CONFIG: "serverName=Docker"
    extra_hosts:
      - "host.docker.internal:host-gateway"  # Required for Xdebug to connect back to host
with the environment variable PHP_IDE_CONFIG we are simply telling our IDE that the serverName is Docker and with the extra_hosts configuration we are telling Docker that the hostname host.docker.internal corresponds to our machine.
Our container is now ready!
To verify if Xdebug is installed in the container you just need to open up a terminal in the container and run the php -v command:
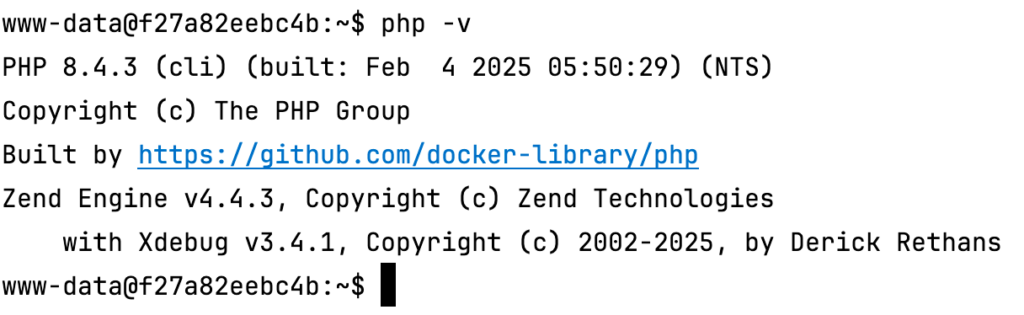
if you see the Xdebug line then you are ready to go.
IDE configuration
PhpStorm
We are going to start with PhpStorm, where we don’t need any plugin to make Xdebug work out of the box.
Debug
First, in PhpStorm open the settings and go in PHP > Debug:
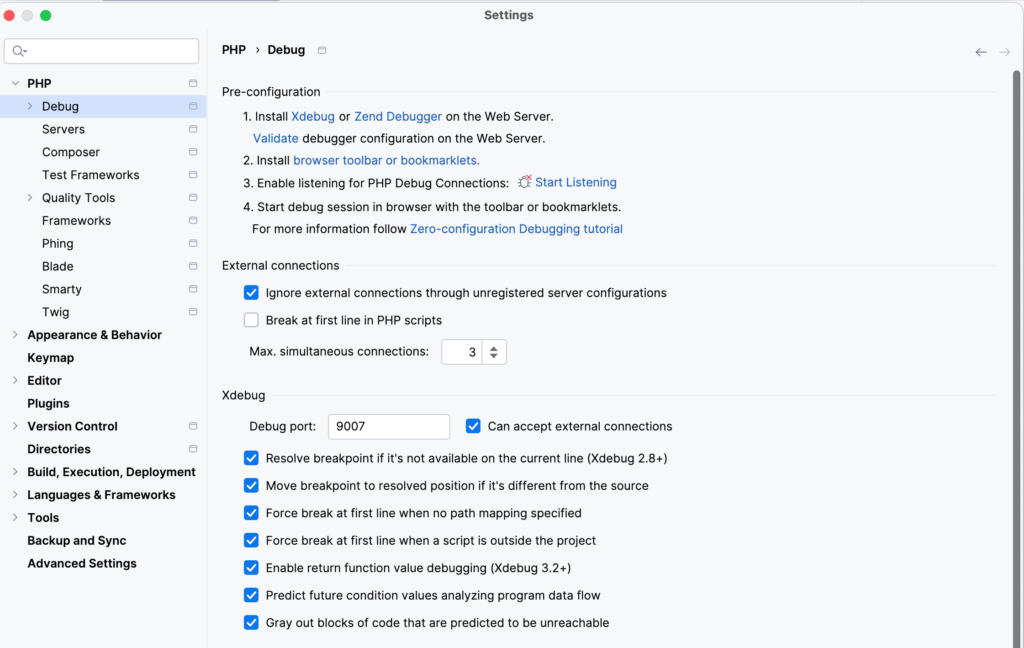
You need to insert the right port (in the image I’ve already set it up to 9007) in the “Debug port” field: this is the port from PhpStorm will listen to signals from Xdebug.
Attention: If this port is different from the one you specified in the Xdebug configuration it will not work.
Advice: you could flag the “Break at first line in PHP scripts” the first time you set this up, so that it will be easier for you to debug any initial misconfiguration.
Server
Next we need to configure a Server, this is useful for path mappings:
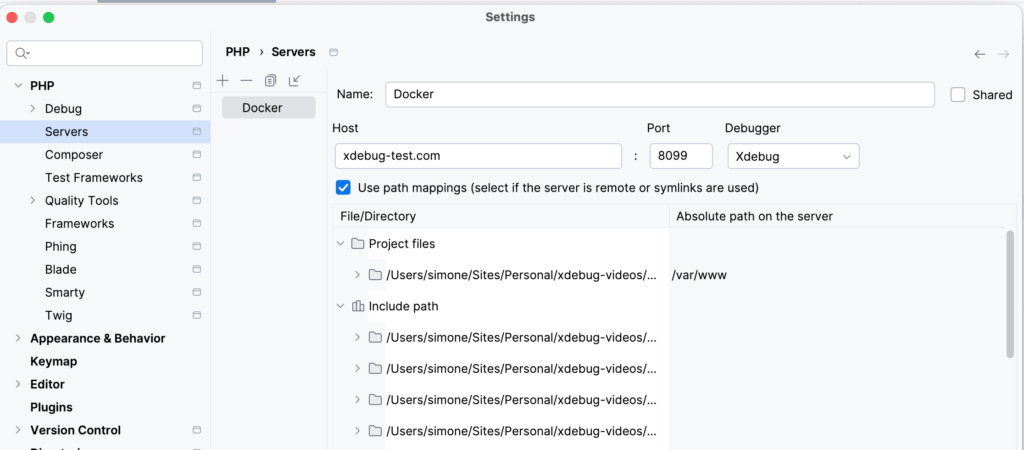
The host should be the hostname of your web application, in my case it’s xdebug-test.com.
Here you see that i used the 8099 port, this has nothing to do with Xdebug, it’s the port where the nginx container exposes the HTTP service. This might not be necessary on your environment, and the port will be typically 80 or 443.
Let’s listen!
The last step is telling PhpStorm to Start Listening to PHP Debug Connections:
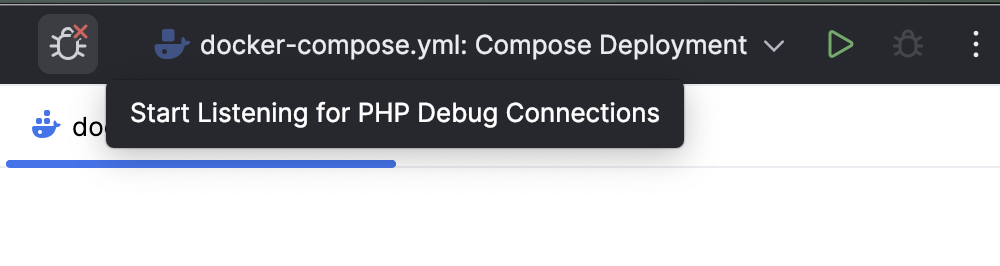
Click on the bug icon and then you will see it like this:

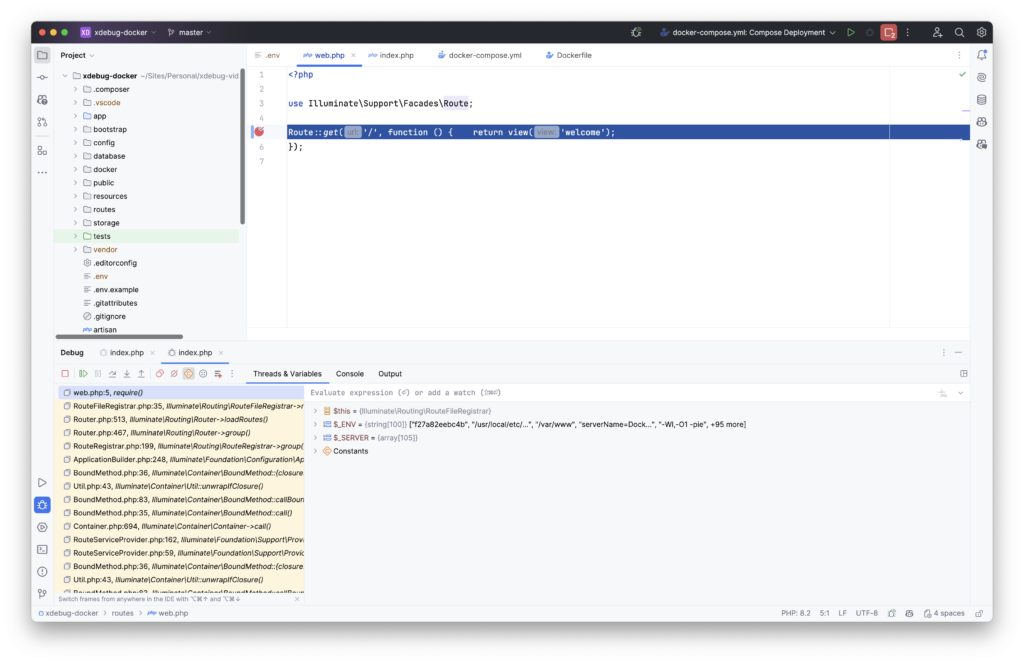
Now, just set up a breakpoint and run your application.
If you followed everything, you should be able to see the stack:
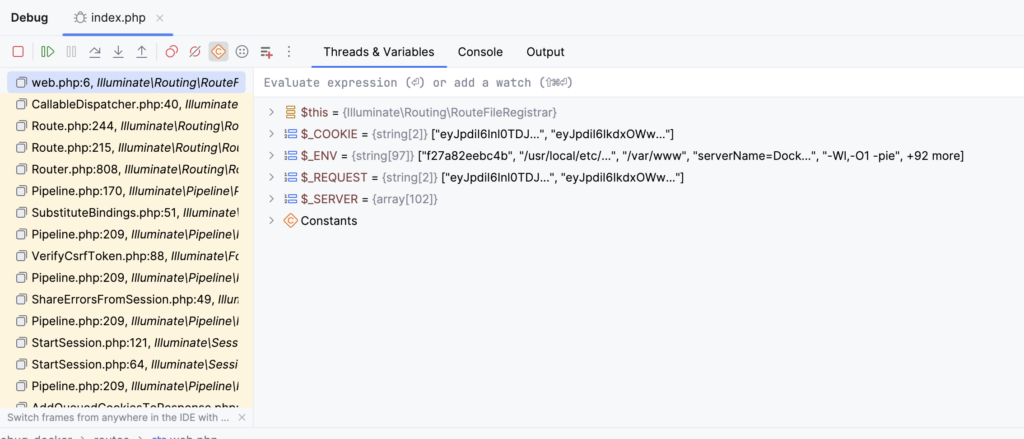
but If you don’t…check this guide again: you may have missed some points 😎. Otherwise: drop me a message on X.
VSCode
In VSCode we need to install a specific plugin: https://marketplace.visualstudio.com/items?itemName=xdebug.php-debug
Once installed, open your application code and click on the Play button with the bug:
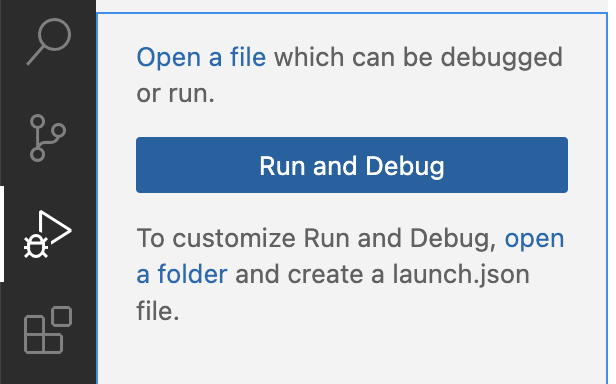
you will be asked to create a launch.json file and you can use this one as example but please change it accordingly by modifying the port and the path as highlighted below:
{
// Use IntelliSense to learn about possible attributes.
// Hover to view descriptions of existing attributes.
// For more information, visit: https://go.microsoft.com/fwlink/?linkid=830387
"version": "0.2.0",
"configurations": [
{
"name": "Listen for Xdebug",
"type": "php",
"request": "launch",
"port": 9007,
"pathMappings": {
"/var/www/your-application-path-in-docker/": "${workspaceRoot}"
}
},
{
"name": "Launch currently open script",
"type": "php",
"request": "launch",
"program": "${file}",
"cwd": "${fileDirname}",
"port": 0,
"runtimeArgs": [
"-dxdebug.start_with_request=yes"
],
"env": {
"XDEBUG_MODE": "debug,develop",
"XDEBUG_CONFIG": "client_port=${port}"
}
},
{
"name": "Launch Built-in web server",
"type": "php",
"request": "launch",
"runtimeArgs": [
"-dxdebug.mode=debug",
"-dxdebug.start_with_request=yes",
"-S",
"localhost:0"
],
"program": "",
"cwd": "${workspaceRoot}",
"port": 9007,
"serverReadyAction": {
"pattern": "Development Server \\(http://localhost:([0-9]+)\\) started",
"uriFormat": "http://localhost:%s",
"action": "openExternally"
}
}
]
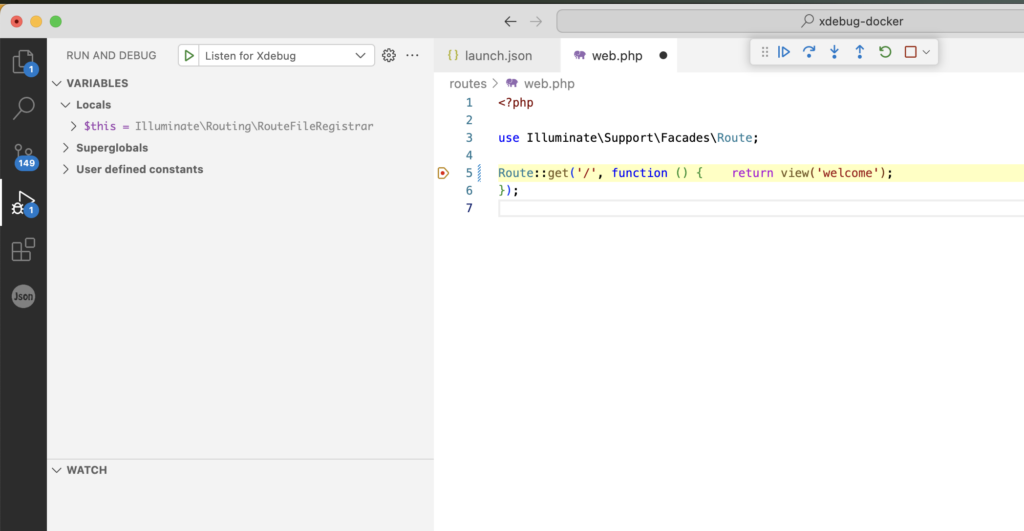
}Then just Start Debugging
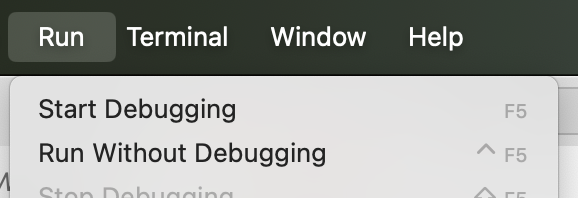
Set a breakpoint where you want to stop the code execution and… that’s it!
Conclusion
I hope this small and quick guide has been useful to you, let me know what you think!
Useful links
Xdebug documentation: https://xdebug.org/docs/
You can find the full repository of the example application here:

